

Automated R&D reporting is the process that automatically collects, processes and distributes information on the status of research and development projects, without requiring extensive manual intervention. In the regulatory field, the OECD Frascati Manual defines the criteria that qualify R&D activities for tax and audit purposes: novelty, creativity, uncertainty, systematicity and transferability. A well-built automated reporting system respects these criteria and produces contextual evidentiary documentation, not reconstructed after the fact. For project managers and R&D teams, this means fewer hours spent compiling reports and more time spent on real research.
What is automated R&D reporting and how does it work
Automated reporting in R&D is based on three distinct phases: data collection, processing and distribution. In the collection phase, the system aggregates information from heterogeneous sources such as CRMs, laboratory diaries, activity tracking systems and project management platforms. The integration between these sources is the critical point: without reliable connectors, the system produces incomplete data.

In the processing phase, artificial intelligence and low-code tools transform raw data into structured summaries. Structured prompts for AI help meet the OECD Frascati criteria, organizing information according to the dimensions of novelty, creativity and systematicity required for R&D qualification. This is not a minor technical detail: it is the difference between a report that passes an audit and one that fails.
Distribution occurs automatically, with reports sent via email or made available on shared dashboards at predefined intervals. The format matters as much as the content: a report that can be read at 9:00 on Monday morning, without the need for manual additions, is already an indicator of the quality of the system. Theintegration between AI and CRMfor technical and management reporting it follows exactly this continuous flow logic.
- Mapping of data sources: Identify all systems that generate data relevant to the R&D project.
- Definition of qualification criteria: align the data fields with the five criteria of the Frascati Manual.
- Connector configuration: Connect sources to the processing engine with low-code tools or APIs.
- Setting the distribution cadence: establish frequency and recipients of each type of report.
- Immediate usefulness test: Verify that the report answers concrete questions without requiring additional consultations.
A tip: Before automating, manually document the reporting process for at least two cycles. You will understand where data is lost and which fields are truly useful for decisions.
What are the concrete benefits for R&D teams?
The most measurable benefit is time reduction. Automated R&D reportingreduces first preliminary version timefrom 6–8 hours to approximately 2 hours integrating AI and structured process. This means that a project manager recovers up to 6 hours for each reporting cycle, hours that are available for high-value activities such as technical analysis and team coordination.
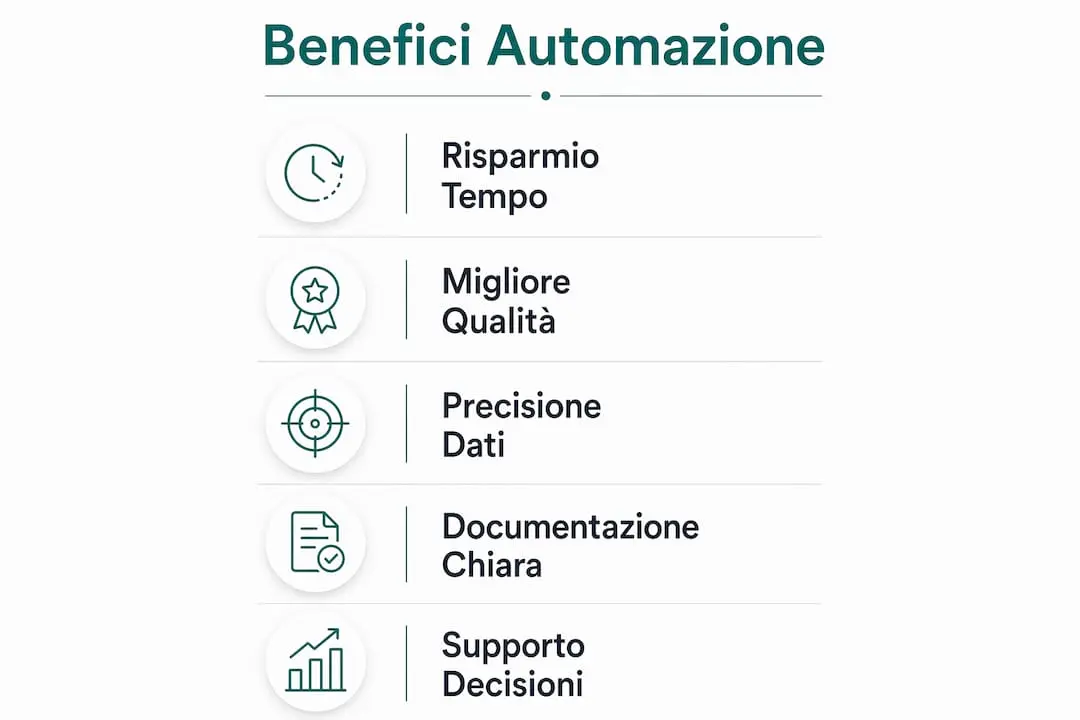
The second benefit is data quality. Automated systems eliminate manual transcription errors and ensure consistency between subsequent versions of the same report. For R&D projects that must pass tax audits, this consistency is not a competitive advantage: it's a requirement. R&D reporting provides evidentiary documentation for tax credit and audits, requiring periodic contextual reports and not just dashboards.
Key benefits for R&D professionals include:
- Reduction of manual errors: Automation eliminates copying data between different systems.
- Regulatory alignment: the reports generated structurally comply with the OECD Frascati criteria.
- Predictive decision support: theAI makes reporting dynamic, identifying hidden patterns and anticipating management needs.
- Transparency towards stakeholders: Automatically distributed reports keep all project stakeholders aligned without follow-up meetings.
- Process scalability: The same system manages a three-person project and a thirty-person portfolio without structural changes.
Over 70% of companiesalready uses AI in financial and operational reporting to increase accuracy and quality. This data indicates that adoption is no longer a pioneering choice: it has become the norm in structured contexts.
What are the limits of automation in R&D reporting?
Total automation is a myth. The final quality of any automated report depends on the quality of the input data and human review, especially when the report is used in tax or audit settings. A well-configured system with poor data produces poor reports more quickly.
An automated report does not replace the judgment of the project manager. It replaces the mechanical work of collection and formatting, freeing up time for the judgment itself. The distinction is fundamental: those who confuse the two levels end up trusting non-validated outputs.
The difference between dashboards and reports is another common pitfall. A dashboard displays real-time data but does not produce the narrative summary needed for an R&D audit. Thecontextual periodic reportanswers specific questions, synthesizes numbers into actionable signals, and has a readable, timely format. Dashboards do not do this by definition.
The main limitations to consider before adoption:
- Garbage in, garbage out: Unstructured or incomplete data input produces unusable reports.
- Subsequent documentation: poorly configured systems risk generating reports that reconstruct activities instead of documenting them in real time, invalidating their evidentiary function.
- Regulatory barriers: Some jurisdictions require digital signatures or specific metadata that not all automated systems handle natively.
- Dependence on human governance: Automation is a hybrid process that requires quality data and supervision, especially in the presence of regulations and audits.
How to implement automated reporting in R&D
Effective implementation follows an iterative path, not a one-time installation. Times vary:2–4 weeks for basic solutionsup to 6–12 weeks for complex systems with many integrated sources. Planning based on the actual complexity of your project portfolio avoids surprises mid-implementation.
- Start with a single data source: Connect the activity tracking system first, verify that the data is clean and complete, then add subsequent sources.
- Define qualification criteria before configuration: align the report fields with the five OECD Frascati criteria from the beginning, not as a subsequent adaptation.
- Use structured prompts for AI: structured prompts for AI help to comply with the criteria of the Frascati Manual, structuring data according to novelty, creativity, uncertainty, systematicity and transferability.
- Apply the Monday morning test: After each iteration, verify that the report answers all operational questions without requiring manual additions or additional consultations.
- Update the data model every quarter: R&D projects evolve and the reporting system must follow this evolution, not photograph an obsolete structure.
The following table compares the two main implementation approaches to help managers choose the most appropriate starting point.
| Criterion | Basic approach | Advanced approach |
|---|---|---|
| Data sources | 1–2 systems connected | 5 or more integrated systems |
| Startup times | 2–4 weeks | 6–12 weeks |
| AI intervention | Formatting automation | Predictive analysis and narrative synthesis |
| Suitable for | Small teams, single projects | Structured PMOs, complex R&D portfolios |
| Regulatory requirement | Basic audit report | Complete contextual documentation for tax credit |
An effective report is never overloaded with data. The effectiveness of the automated report is recognized when it provides all the useful information without requiring manual integrations or multiple consultations. If the recipient has to open three other files to understand the report, the system doesn't work.
A tip: Involve the R&D team in defining the report fields before configuring the system. Those working on the project know which data is always missing and which is never read.
Key points
Automated R&D reporting reduces reporting time, improves data quality and produces OECD Frascati compliant evidentiary documentation, but requires human governance and structured data to function properly.
| Point | Details |
|---|---|
| Operational definition | Automated reporting collects, processes and distributes R&D data without extensive manual intervention. |
| Measurable time savings | AI reduces the first preliminary version from 6–8 hours to approximately 2 hours per reporting cycle. |
| Regulatory compliance | Reports must comply with the five OECD Frascati criteria to pass audits and obtain tax credits. |
| Main limit | The quality of the report depends on the quality of the input data and the supervision of the manager. |
| Phased implementation | Start from a data source, test with the criterion of immediate usefulness, then add complexity. |
My vision for R&D reporting in 2026
I have been working with R&D teams for years and I have seen a clear change: reporting has gone from an end-of-project activity to a continuous process integrated into the daily workflow. This change is not driven by technology itself, but by regulatory pressure and the need to make faster decisions with reliable data.
What worries me is the tendency to confuse automation with total delegation. I have seen teams adopt automated reporting systems and then stop reading the reports, convinced that "the system will take care of it". The result is formally correct but strategically empty documentation. AI enhances the professional by making him capable of anticipating problems, it does not replace him in judging them.
The future I see is that of predictive reporting: systems that not only document what happened, but report where the project is going and why. Low-code technologies and generative AI make this possible even for teams without dedicated IT resources. The advice I always give to project managers is to gradually adopt, actively govern and never automate a process that you don't yet fully understand.
— Vinicio
Viniciolupo and the advanced management of R&D projects
Those who manage complex R&D projects know the real cost of fragmented reporting: wasted hours, inconsistent data and difficult audits to overcome.
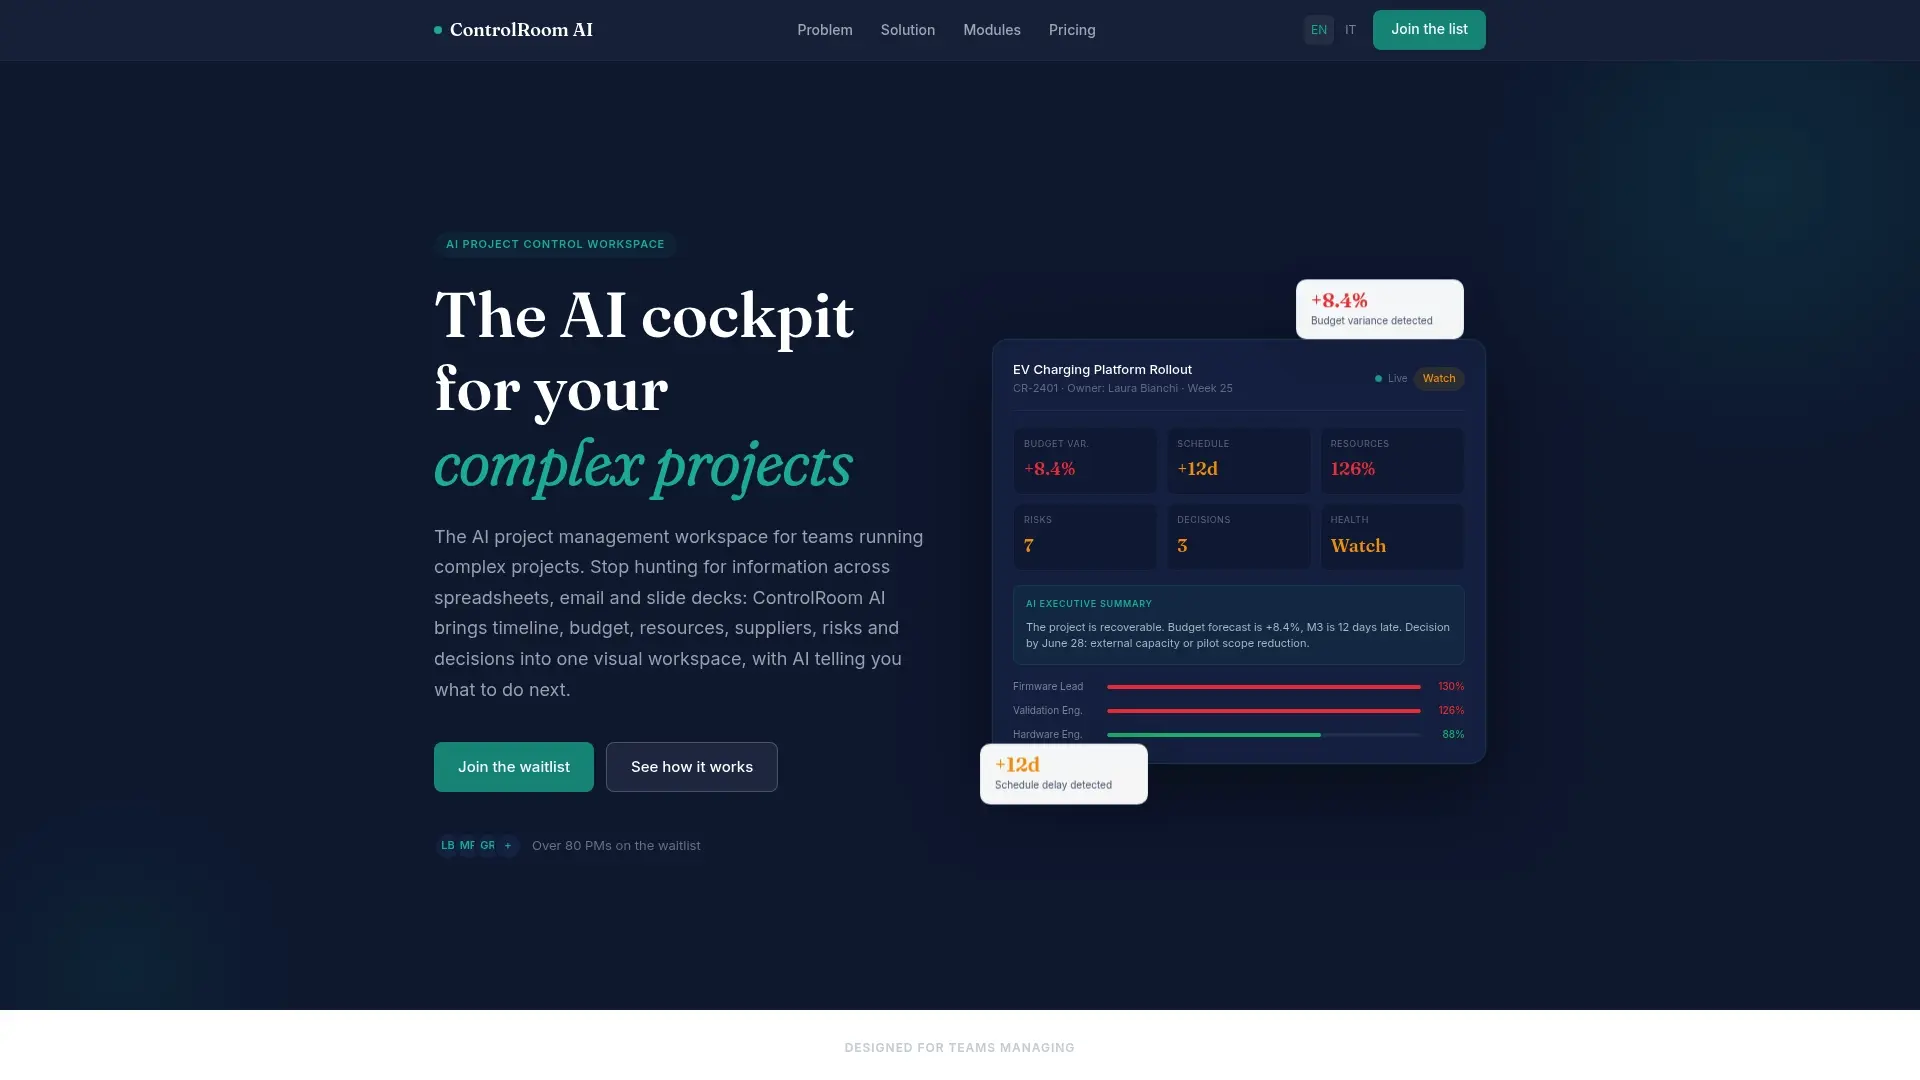
Viniciolupo has developedControlRoom AI, a workspace for managing complex projects that integrates automation, artificial intelligence and dashboards into a single environment. R&D managers find in ControlRoom AI a tool to centralize project data, generate reports compliant with OECD Frascati criteria and maintain transparency towards all stakeholders. For those who want to leave without obligation, Viniciolupo also offers onecollection of free toolsto experiment with process automation before adopting a structured solution.
Frequently asked questions
What is automated R&D reporting in brief?
Automated R&D reporting is a system that collects, processes and distributes data on research projects without extensive manual intervention. Produces contextual documentation compliant with OECD Frascati criteria for audits and tax credits.
How long does it take to implement an automated reporting system?
Times vary from 2–4 weeks for basic solutions up to 6–12 weeks for complex systems with many integrated sources. The complexity of the project portfolio is the determining factor.
Does automation completely replace the work of the R&D manager?
No. Automation eliminates the mechanical work of collection and formatting, but content validation and strategic judgment remain the responsibility of the professional. The final quality depends on the quality of the input data and human supervision.
Why must R&D reports comply with the OECD Frascati criteria?
The criteria of the Frascati Manual (novelty, creativity, uncertainty, systematicity, transferability) are the regulatory reference for qualifying R&D activities for the purposes of tax credit and tax audits. A report that does not meet these criteria does not constitute valid evidentiary documentation.
What is the difference between a dashboard and an automated R&D report?
A dashboard displays real-time data but does not produce the narrative summary needed for an audit. An automated report answers specific questions, translates numbers into actionable signals, and has a readable format delivered at predefined cadences.